How To CyToF - The OHRI guide to mass cytometry
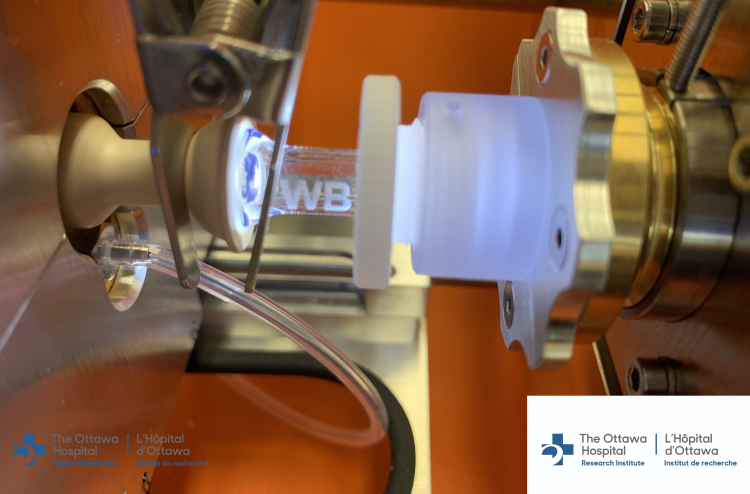
Mass cytometry in action!
Mass cytometry or Cytometry by Time of Flight (CyToF) is a modern technique that leverages the power of traditional cytometry techniques (staining millions of cells in suspension with labelled probes) with the sensitivity and specificity of mass spectrometry. By changing the traditional fluorophore probes in flow cytometry to rare-earth metals we overcome many of the problems associated with flow cytometry:
- Reduced background
- Reduced compensation
- Rare-earth metal probes have a fraction of the spillover of fluorescent probes
This means we can increase the number of parameters used - mass cytometry experiments typically use 30-50 probes.
The increased number of probes allows users to gain more insight:
- Combine multiple panels into one
- Deeper phenotyping of heterogeneous populations
- More markers = better insight into which specific cells comprise heterogeneous populations
- Combine phenotyping with interrogation of signaling pathways
- Identify cells with phenotypic markers and then examine which signaling pathways are active.
The OHRI Mass Cytometry Service (part of the Proteomics Core Facility) was established in 2019 and offers a state-of-the-art instrument and a mass cytometry specialist to help you establish and complete your projects.
We offer a full service and can assist you with all aspects of your mass cytometry applications:
- Experiment Design
- Panel Design
- Antibody conjugation
- Sample Preparation
- Staining Optimization
- Sample Acquisition
- Data Cleaning
- Data Analysis
Here, you will also find guides and resources to help you get up and running with your projects.
Prices:
| Sample Acquisition |
$140/hr (2hr minimum) |
| Antibody Conjugation |
$350 |
| Panel, Method, Analysis Consultation |
$50/hr |
| Antibody/Test |
$6 - ask for list of currently stocked antibodies |
Succeed with mass cytometry
So you want to use mass cytometry as part of your project?
This is a brief guide to techniques and best practices for mass cytometry. It provides information to help you plan and undertake your mass cytometry project at OHRI. Support and more in-depth detail for any step of your project is available from the Mass Cytometry Service Specialist (dcarragher@ohri.ca) . Any feedback on improving this document is also welcome.
First we’ll see how the technology works and then discuss tall aspectsyou should be thinking about when planning and carrying out your mass cytometry experiments.
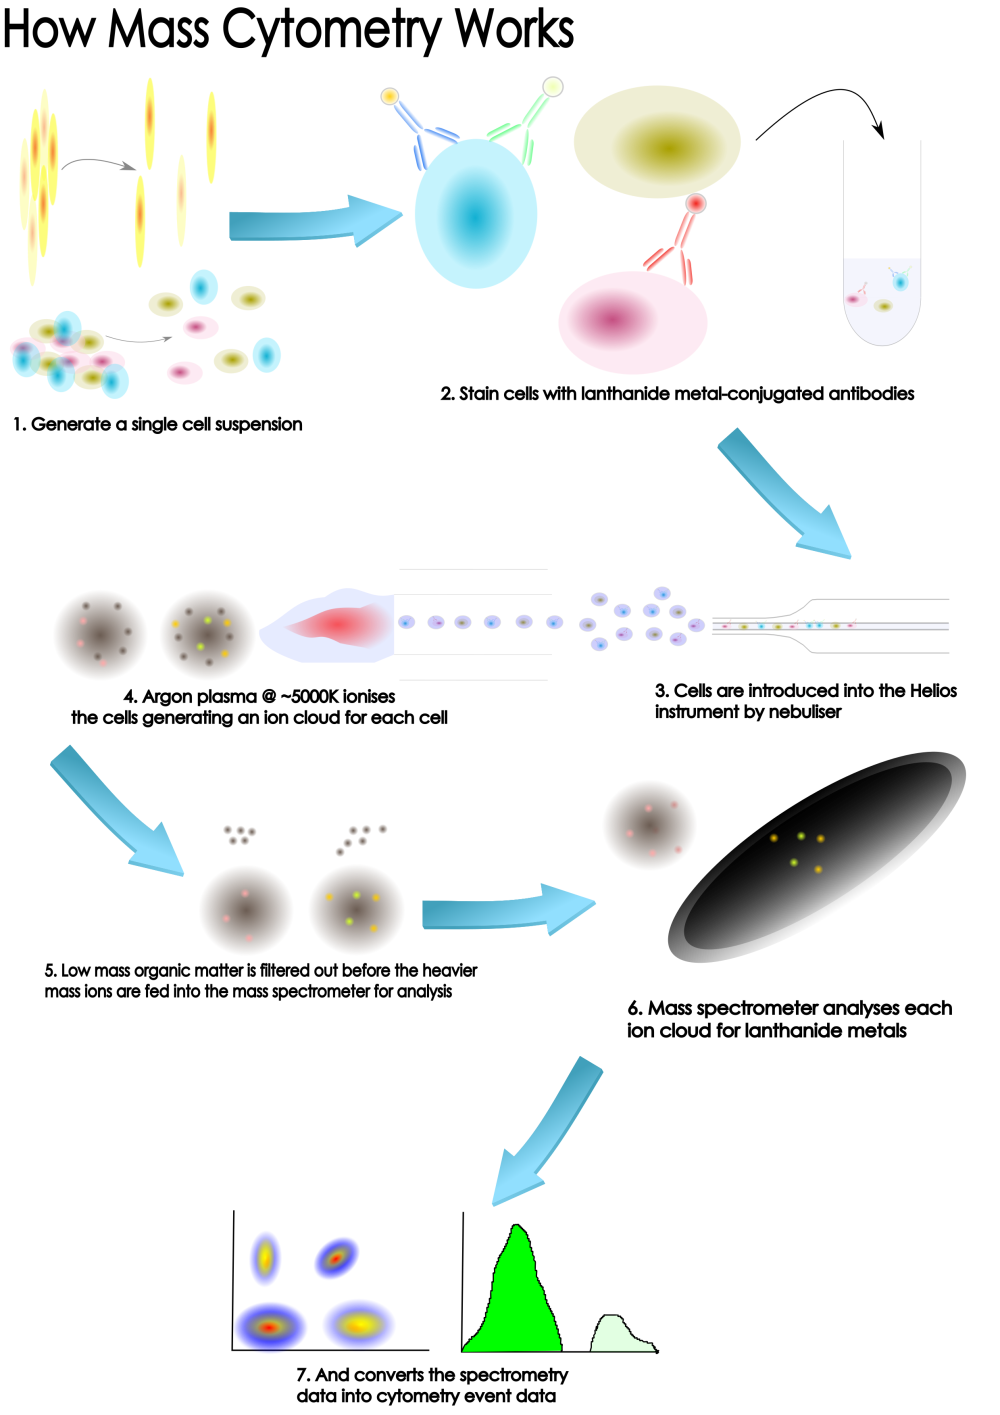
How it Works
Why CyToF?
Firstly, what are the advantages of the technology and the reasons to use mass cytometry as part of your scientific study? Here at OHRI we have a Fluidigm Helios instrument.
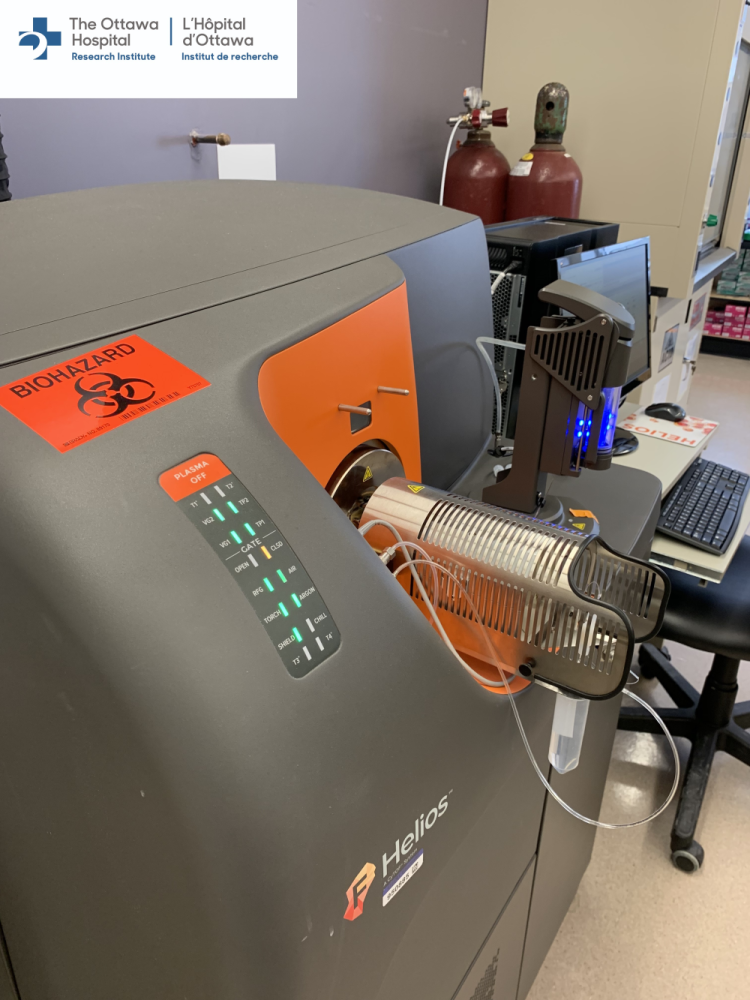
The Fluidigm Helios is a 3rd generation CyToF instrument with top of the range sensitivity
Unparalleled high dimensional analysis of cells
Mass cytometry (and the Hleios in particular) is primarily an extension of, or complement to, traditional fluorescence-based flow cytometry analysis. It allows for more parameters to be measured than current flow cytometry techniques.If you’re familiar with flow cytometry techniques and analysis you’ll definitely have a head-start in mass cytometry - the approaches and techniques are very similar. If you have no flow cytometry experience, don’t worry, we’re here to guide ou and make your projects a success.
Mass cytometry provides a high-resolution proteomic profile at the single cell level. What does that actually mean? We can measure 40-50 different proteins at on every cell in your samples (hundreds of thousands or even millions of cells). Mass cytometry is a single-cell technique like RNA-seq but because we are meauring proteins via antibodies we can also measure the cell signalling or function (vy using phospho-specific antibodies). More and more researchers are integrating mass cytometry into their single-cell assays and pipe-lines toyield more information and combine their data with sequencing and other assays. Mass cytometry gives you a more comprehensive functional and phenotypic characterization of complex systems with unprecedented resolution and a strong complement to yuor other single cell assays or flow cytometry approaches.
Overall, mass cytometry gives you:
- The ability to detect and quantify more than 40 user-defined markers.
- Additonal channels set aside for functional markers like live-dead discrimination, barcoding, DNA and thymidine anlaogues. In flow cytometry you have to use standard channels for these markers. In mass cytometry they come for free leaving you a true 40 channels for the markers you are interested in.
- Simultaneous phenotypic and functional assays lead to substantial improvement in the understanding of the cell states and functions - phenotpye cells and interrogate signalling pathways at the same time by using phospho-specifc antibodies or histone marks.
- Remove the limitations of spectral overlap of fluorescence and the dysfunction of fluorophores inside cells to allow targeting of more intracellular proteins.
- Full signature identification for each intact cell prevents the need to cross-correlate - combine your current separate smaller panels into one large panel.
Why NOT CyTOF?
Mass Cytometry is a powerful and flexible technique. It can be the best approach to address many scientific questions, but, like any other technology there are drawbacks. There are several aspects to mass cytometry that might make it incompatible with your question or model.
Throughput
Compared to flow cytometry, mass cytometry is very slow: * 30ul/min maximum throughput * 300-500 events/sec optimal recording rate
The fastest rate we can feed sample into the instrument is 30ul/min, which is quite slow. This shouldn’t be a problem as we are still free to increase the cell concentration to make up for the limited volume/min. However, studies have shown that running samples faster than >500 cells/sec causes large increases in doublet formation with very small increases in single cell acquisition. For this reason we do not run the instrument at >500cells/sec and often prefer to run at 300 cells/sec if compatible with your requried acquisitions.
No scatter measurements
In flow cytometry we can use light scatter parameters to enhance our ability to discriminate cell types. We don’t have these parameters available in mass cytometry and the analogues we do use are not sensitive enough to discriminate cell types in the same way. If scatter parameters are vital to your ability to discriminate cell types and we can’t find a probe to use in mass cytometry, this technique may not be viable for you.
“Lossi-ness”
The protocols required for mass cytometry result in large amounts of sample loss. There are 2 steps where sample loss occurs:
- Staining techniques are very harsh
- strong fixation and permeabilisation reagents
- Samples centrifuged upwards of 12 times
- Acquisition
- Cells are nebulised into a spray chamber before introduction by vacuum into the instrument for anlaysis. 30-50% of the nebulised sample adheres to the spray chamber walls before it can be drawn into the detector array.
What does this mean for your samples?
- For unlimited sample size to acquire 500,000 events you may need to start with a starting sample containing 2-3x10⁶ as half your sample might be lost to stainign and processing and a further half will not make it to the instrument detector.
- 5x10⁴ is probably the smallest sample size we can use for mass cytometry and get useful data. This lets us acquire 10-25,000 events.
- For small samples there are techniques we can use to reduce the losses, such as fingerprint your sample and add it to a large bolus of irrelevant cells (which can be removed at data analysis).
Cost
The cost of doing experiments in mass and flow cytometry are comparable but: * For flow you probably have reagents in your fridge to build larger panels around. If this is your first mass cytometry experiment you will have to buy every probe and reagent. * The large increase in available channels means that you will gain large increases in information per cell but also means that you will be purchasing 30-40 antibodies for mass cytometry compared to the <20 you will need for the largest flow cytometry experiment. Buying 30-40 antibodies rather than 20 is 1.5-2x the price but should provide more than double the information per cell.
Acquisition costs are very low compared to reagent costs (they are comparable or sightly mroe than the he cost of cell sorting).
Fixation
Samples must be fixed before introduction into the Helios instrument. If your studies require live cells, for instance if you are studying calcium flux or changes in a reporter protein, fluorescent approaches may be betetr for you.
Sample Destruction
All cells undergoing mass cytometry analysis are completely destroyed (ionised by plasma) so there is no possible way to use the analysed cells for downstream applications.
Planning out your mass cytometry project
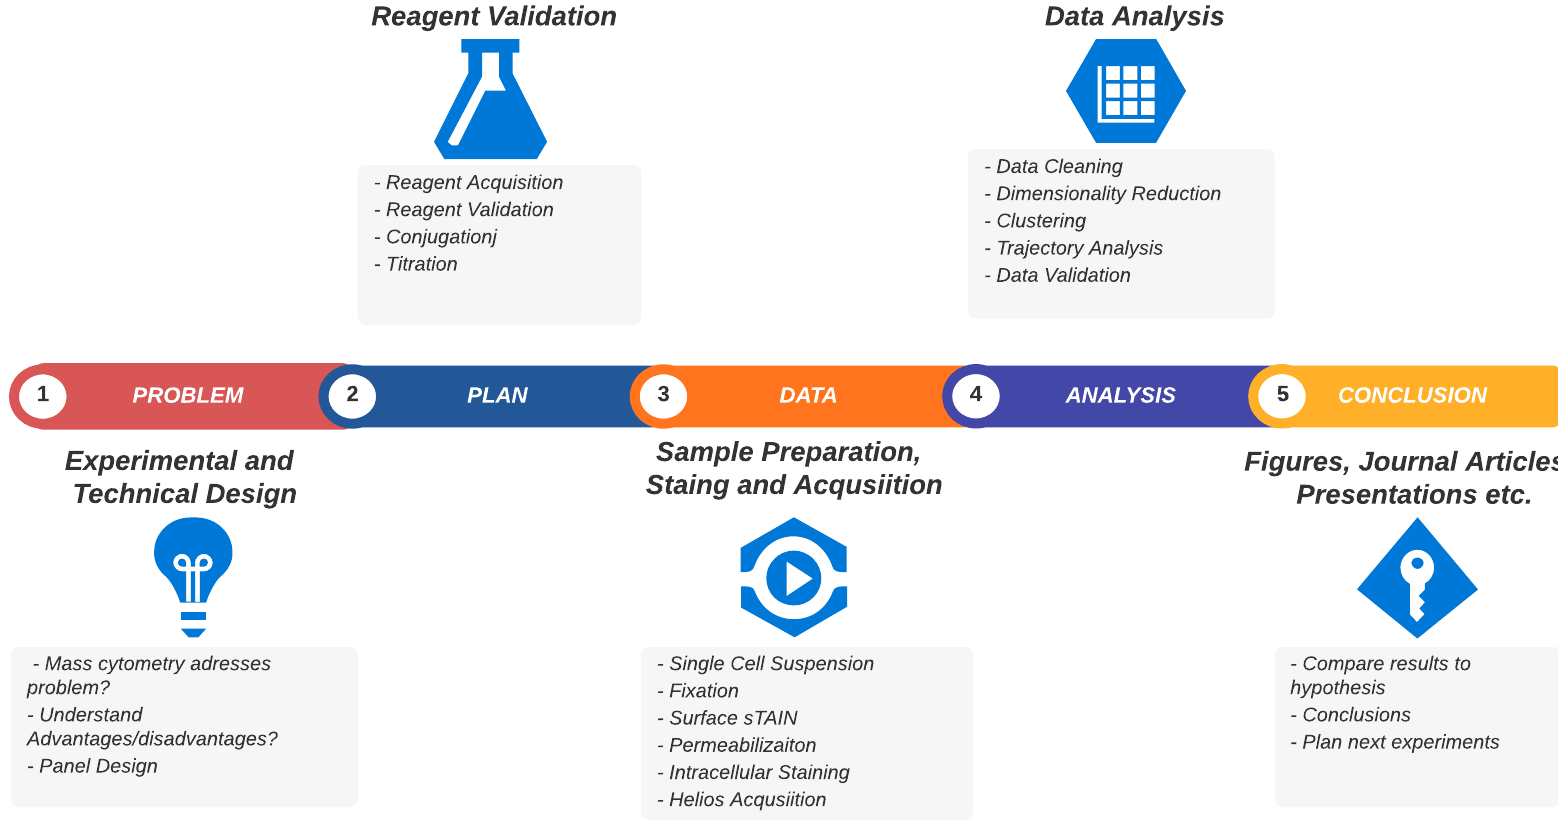
A typical mass cytometry project workflow
Now that you understand the technology we’ll give you an overview of the practical aspects of undertaking a mass cytometry project. We’ve broken it down into the discrete sequential steps that are necessary (or highly recommended) to start, plan and complete your project. This is summarised in the table below and the figure above. We’ll go into more detail for each step after that.
| PROBLEM |
Scientific Question |
Is mass cytometry appropriate to answer your question? |
| PLAN |
Experiment Design |
How will you analyse your cells?
Do you need to multiplex?
How large are your samples?
How many cells should be acquired |
| PLAN |
Panel Design |
Optimally assign probes to rare metal isotopes
What probes will you use? |
| PLAN |
Reagent Acquisition |
Acquire metal-tagged probes or purified probes and conjugate them to rare metal isotopes |
| PLAN |
Sample Preparation Optimisation |
Generate single cell suspensions, reduce debris and “clumping” and enhance survival and cell viability |
| PLAN |
Staining Optimisation |
Finding optimal conditions to resolve surface-, intra-cellular and intra-nuclear staining simultaneously |
| PLAN |
Titration |
Find optimal concentrations of antibodies to enhance resolution and reduce background |
| DATA |
Acquisition |
Acqurie samples on Helios |
| ANALYSIS |
Data Cleaning |
Debarcoding
Normalisation
Lineage Removal
Dead cell removal |
| ANALYSIS |
Data Analysis |
Dimensionality-Reduction
Clustering
Trajectory Analysis etc. |
| CONCLUSION |
Interpretation |
Answer your question |
The table above should help suggest:
- Some of the questions you should be asking to effectively plan and manage your CyToF project
- That planning and optimising the project will be the largest and hardest part of the project
Now, we’ll break down these steps, the best approaches to take and common pitfalls you may encounter in your mass cytometry journey.
Technical Design
If after understanding the pro’s and cons, you have decided that CyTOF techniques are appropriate toyour model we will must underatke the technical design and reagent preparation for your project.
The technical design of experiments will take the majority of time in a mass cytometry project. Getting these parts right makes the rest of the process simple and easy . It incorporates: 1. Identify appropriate markers to analyse phenotypic and/or functional changes in your cells or tissues of interest 2. Source probes and antibodies to assess those markers 3. Panel Design Pair probes with labels to create an easily used panel of probes 4. Validate probe-label pairs on real samples (titrate and check specificity) 5. Iterate - with 30-40 arkers it’s important to understand that a panel design (and staining protocol is probably not going to be optimal on our first try!) 6. Test staining protocol We can adapt flow cytometry protocols to stain cells BUT the ability to add a wide range of markers - surface, cytoplasmic and nuclear simultaneously, means protocols often have to be refined to ensure optimal staining for all of the different staining modalities - We are often in a situation where our detergent permeabilisation protocol is interefering with surface staining or our methanol fixation/permeabilisation is interfering with other antibody staining and must refine our protocol to maximise all antigody staining.
Identify and Source - Reagent Acquisition
Directly conjugated antibodies are exclusively available from Fluidigm at the moment. Their catalogue is extensive and ever-expanding but tends to focus on immunology and immuno-oncology with small reach into stem cell biology. If your research area is outside these options it’s likely that you’ll have to source some or all reagents from different vendors. We can conjgate almost any antibody to any of the lanthanide or cadmium metals at OHRI so it will defintiely be possible to get reagents suitable for your studies.
Identifying appropriate reagents
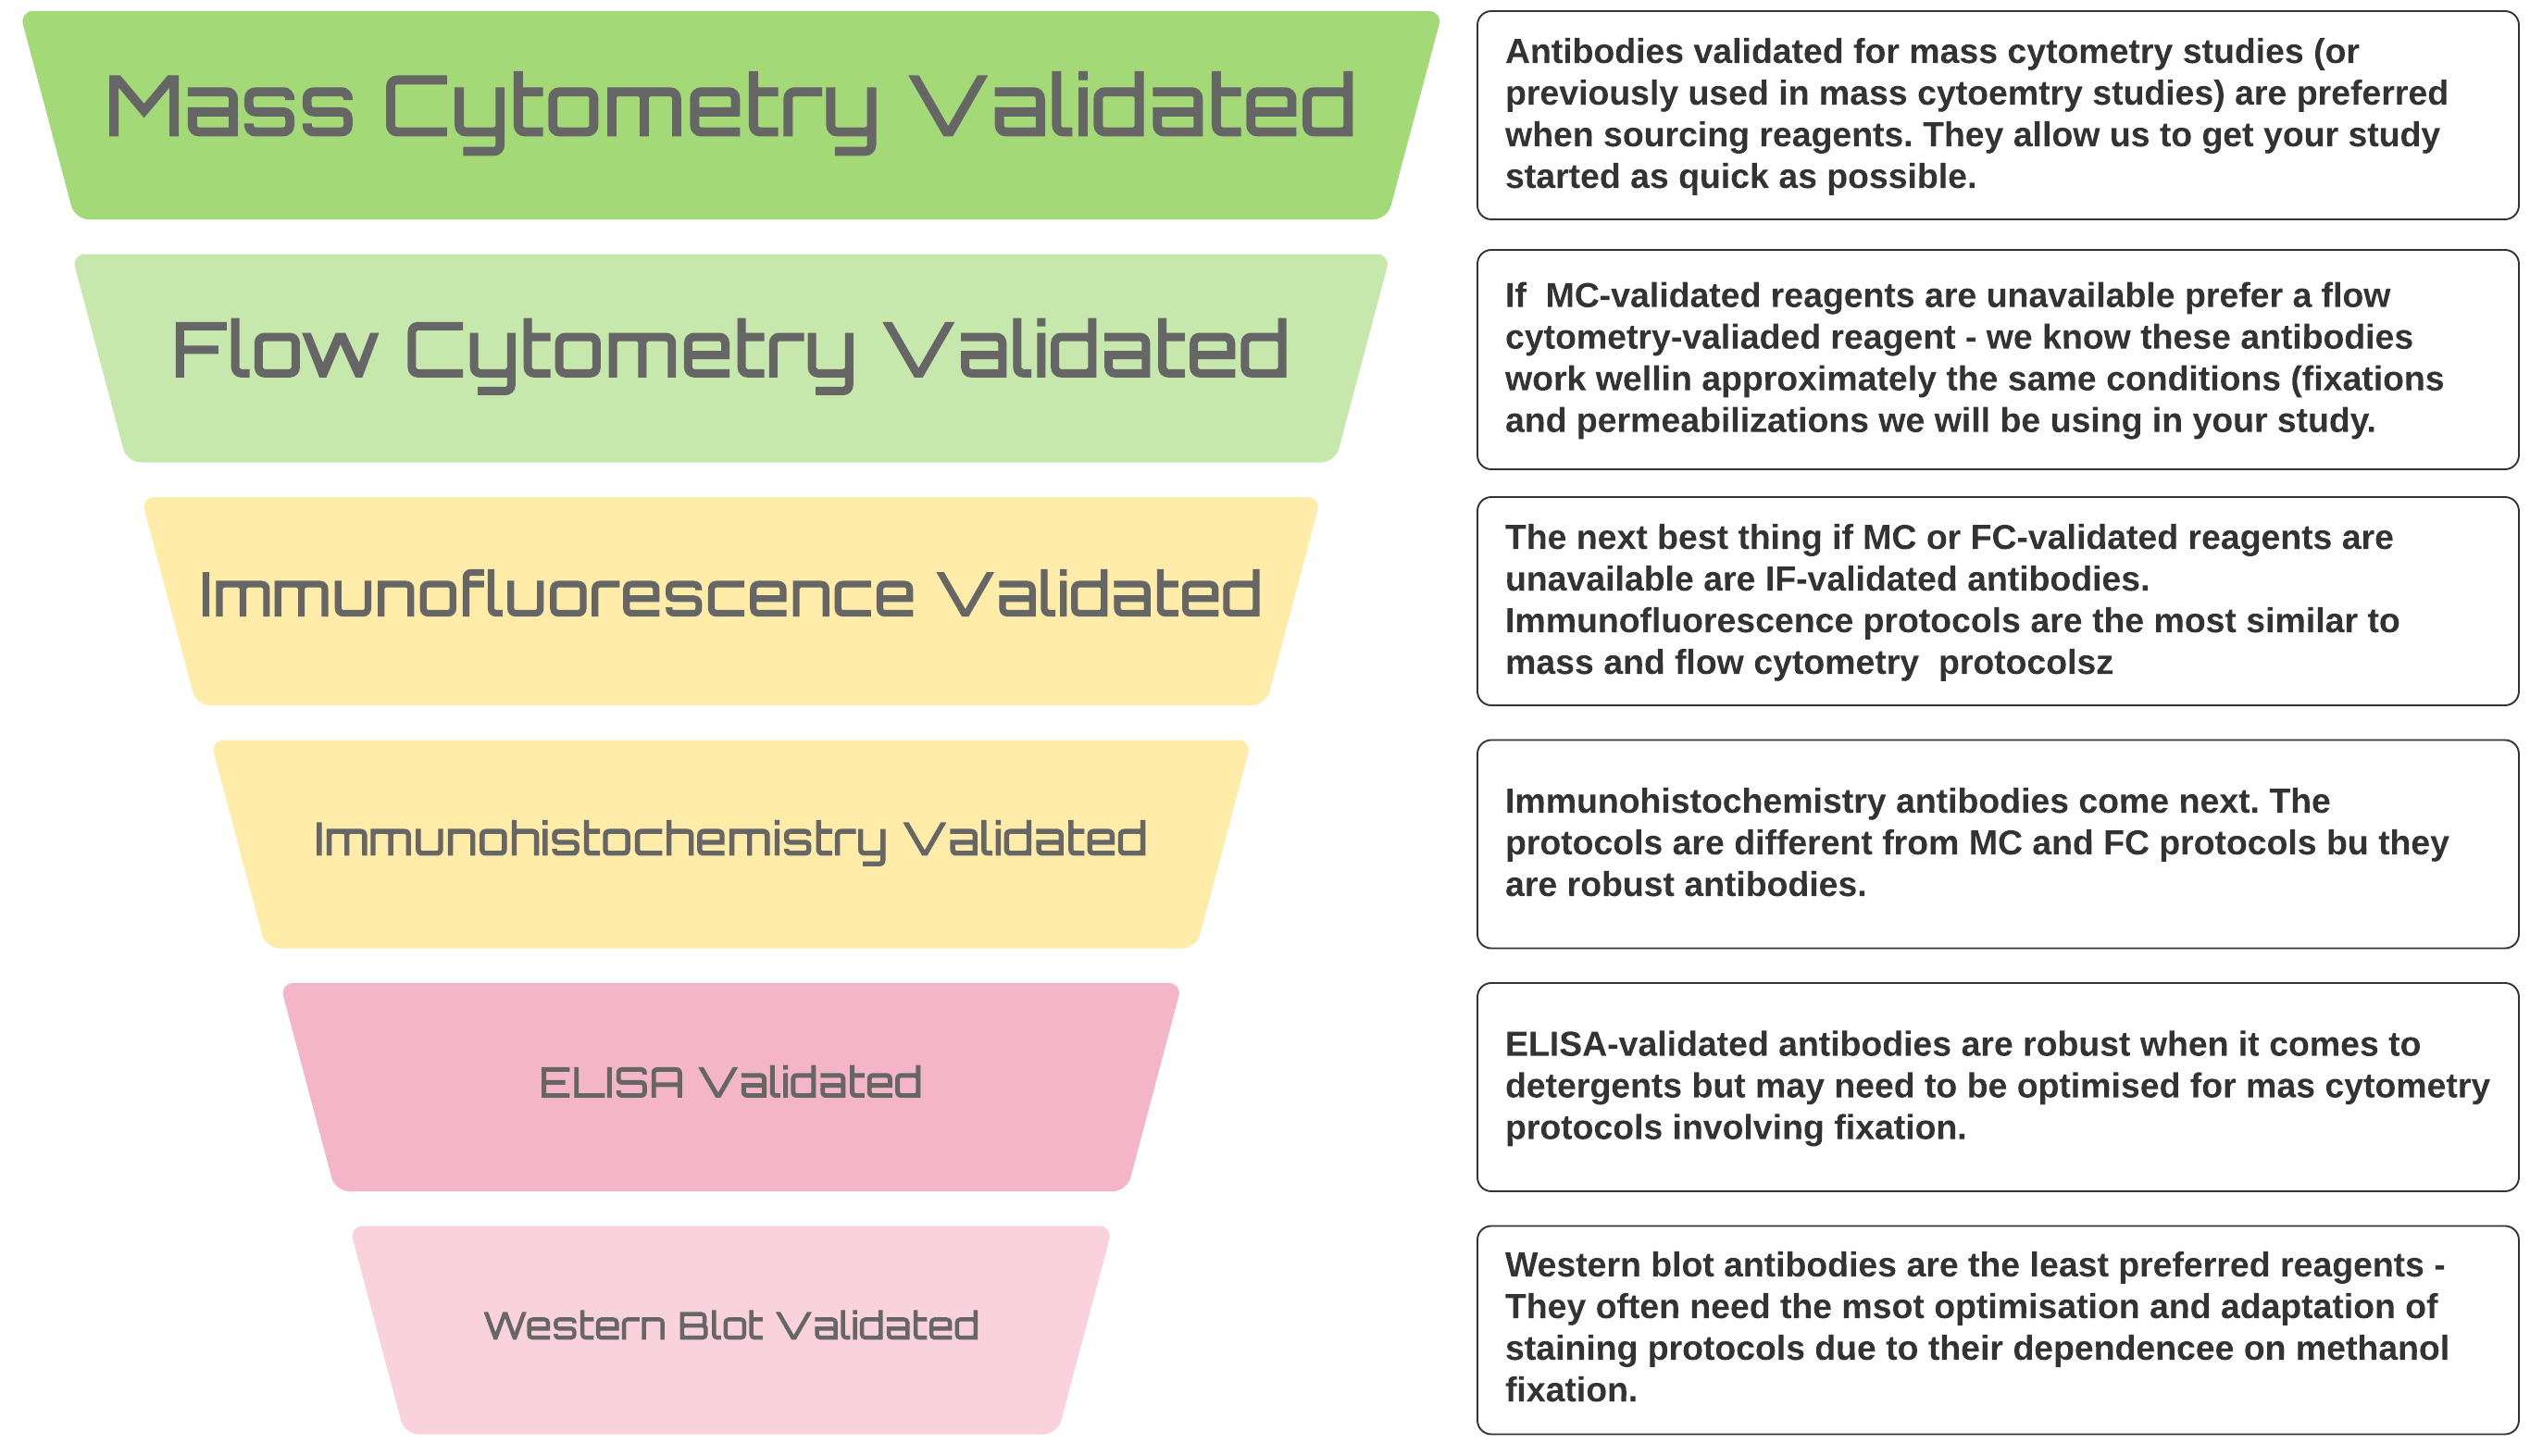
With optimisation, we can get any probe working for your mass cytometry study but there is a definite hierarchy of preferences when it comes to sourcing reagents
It’s always better to use antibodies that have previously been used in mass cytometry studies or, if that’s not possible, at least in flow cytometry studies - we KNOW they work in the types of application we will be applying them to. Furthermore, monoclonal antibodies are preferred for these studies. Monoclonal antibodies conjugate more efficiently and generally behave better in the harsh protocols required to label cells and prepare them for CyToF analysis.
However, it’s not always possible for novel studies and we can make antibodies that have been used for Western or immune-blotting work. We have successfully labelled polyclonal antibodies so all is not lost if there is no monoclonal available. Basically, we can get anything to work but validated mAbs will save you time and tears in the long run as they will get you up and running more quickly and more easily and work better from lot to lot over longer projects.
There are some other things that you should bear in mind when purchasing antibodies for mass cytometry from different vendors: * Vendors are staring to provide mass cytoemtry-ready formulations (look for CyToF-ready or mass cytometry ready) * If there are no mass cytometry-specific formulations, look for in-vivo ready products (like LEAF from Biolegend or NA-LE from BectonDickinson) * Like with other applications there are good vendors and bad vendors for antibodies. We have had good results with antibodies from RnD, BD and Biolegend, whilst we cannot recommend rreagents from Sana Cruz. * __Regardless of your vendor there are specific things you should look for when sourcing reagents: * NO BSA - this severely inhibits conjugation reactions * NO Carrier Protein - sometimes vendors substitute other carrier proteins instead of BSA, these can also inhibit the conjugation reactions * Glycerol, Glycerin and Azide in small concentrations are okay * If the only formulation you can source contains BSA, abcam have a BSA removal kit or Thermo have an antibody clean-up kit.
Panel Design
Once you have sourced the appropriate reagents we need to assign one reagent to each channel on the mass cytometer. Panel design for cytometry experiments is the art of pairing probes (generally antibodies) with detected-molecules (fluorophores for flow or conjugated lanthanides and cadmiums for mass cytometry) so that expression differences are maximised and emphasised. It’s important to unserstand 2 things about the instrument before we apply our panle design rules:
Which channels are available to assign antibodies to
There are approximately 44 user assignable channels available across the 100+ channels on the instrument
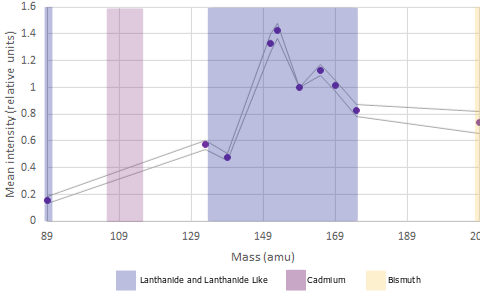
Lanthanides are available in the mass ranges 89 and 141-176 (excluding 157; it exists but is prohibitively expensive to use due to its rarity), Bismuth can be used in channel 209 adn Fluidigm have recently released 7 Cadmium isotopes in mass ranges between 106 and 116.
and which channels have the highest sensitivity
With this information we can generate a panel using:
The 2 basic rules of panel design
| Measure your most important markers in the most sensitive channels |
Place markers that appear on the same cell in neighbouring (or interacting) channels |
Assigning antibodies to labels (metals or fluorophores)
Like in flow cytometry we measure our labelled probes in specific “channels”. For flow cytometry each channel is a laser/filter/fluorochrome/PMT combination. In mass cytometry we have mass ranges from 141-176.
Like in flow each of these channels are not created equally.
In flow, for instance, we have brighter or more efficient fluorochromes such as BV421, PE or APC. We assign the probes that are most interesting to us or whose marker is expressed the least to the higher sensitivity channels, which gives us the best opportunity to pick up differences in low-expressed markers or those we think might show differences we are interested in the best.
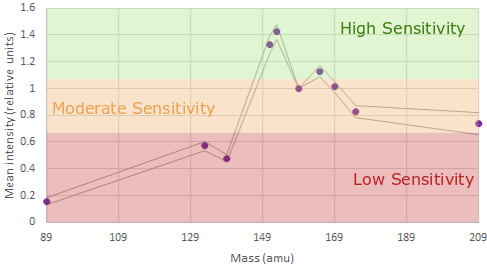
In mass cytometry there is a similar principle at work. We don’t have differences in our metal labels - we are just measuring mass which is invariate. However the machine is tuned to be more sensitive in detecting those masses in a specific range see the figures above).
For the Helios, the area of the mass range that is most sensitive is around 153-165. These channles should be used for our most important or lowest-expressed antigens of interest . Furthermore, there are also differences at either end of the mass range.
Around 140 is the area of least sensitive detection for lanthanides. The area around 170+ is lower sensitivity than around 160 but better than at 140. Additionally, we now have the cadmium metal conjugates to worry about. The masses of the cadmium isotopes are 106-116. As you can imagine, if the mass range around 140 is low sensitivity, the mass range 30 lower is very low sensitivity. If we are to use the cadmium isotopes in a very large panel we must assign very highly expressed, very easy to distinguish positive-from-negative markers (think things like CD4 or CD8) or it won’t be worth using these probe-metal combinations at all!
Reagent Validation
Panel design is an iterative process that is shaped by the reagent validation processa. When we conjugate antibodies in-house the antibody undergoes strong reduction so that we can link a lanthanide to the antibody. As part of the validation process we demonstrate that there is protein present, that the protein is an antibody (binds to compensation beads through light chain) and that the correct metal (and only that metal) is present on the antibody tube. After this all antibodies are titrated (using known positive and negative expressing cells) so that we can assess specific and non-specific staining and assess the correct amount of antibody to use on our samples).
a If you want to see good examples of panel design check out the Optimised Multicolour Immunofluorescence Panels published in the journal Cytometry Part A. They are a special type of journal article that catalogue the process of creating a specific immunofluorescence panel , the difficulties that were overcome, the iterations required and the final panel is detailed with specifics on reagent sources, clones and instruments use. They are a very good lesson in excellent panel design and validation.
Sample Preparation and Staining
The general approach to sample preparation and staining with some common optional procedures
Preparing your sample and then staining is the most crucial part of the entire workflow. It may also be the aspect of this workflow that takes the longest to optimise (or at least much longer than you expect). Poor sample preparation leading to poor data is one of the major pitfalls we need to avoiare often performed on much more heterogeneous samples - the increased number of channels allows us to phenotype more heterogeneous samples without the need for enrichment for instance. Many flow cytometry panels rely on surface stains (for instance when sorting live cells) or perhaps incorporate cytoplasmic cytokine staining in addition to surface stains.
For mass cytometry, because we have the ability to use so many channels we are more likely to combine staining for surface, cytoplasmic (like cytokines) nuclear (transcription factors, histone marks etc.) and functional readouts like phosphoprotein staining into one panel. In all of these cases different staining conditions will be optimal. If we stain for all of them simultaneously we often need to compromise each staining protocol so that it works sufficiently without disrupting other stsining modalities too much (e.g. phosphoproteins often need methanol fixation or permeabilization. Optimising and compromising our staining is essential to get measureable valid staining activity in all channels.
Single cell suspension Preparation
As with flow cytometry this can be the most important aspect of sample preparation. Finding an optimal method to generate single cell suspension from your culture or tissue will require substantial optimisation to reduce losses through cell death and reduce the amount of debris. Things to consider include: * Accutase instead of trypsin * GentleMACS to disrupt tissues (increases yield and reduces cell death * Debris and/or dead cell removal kits
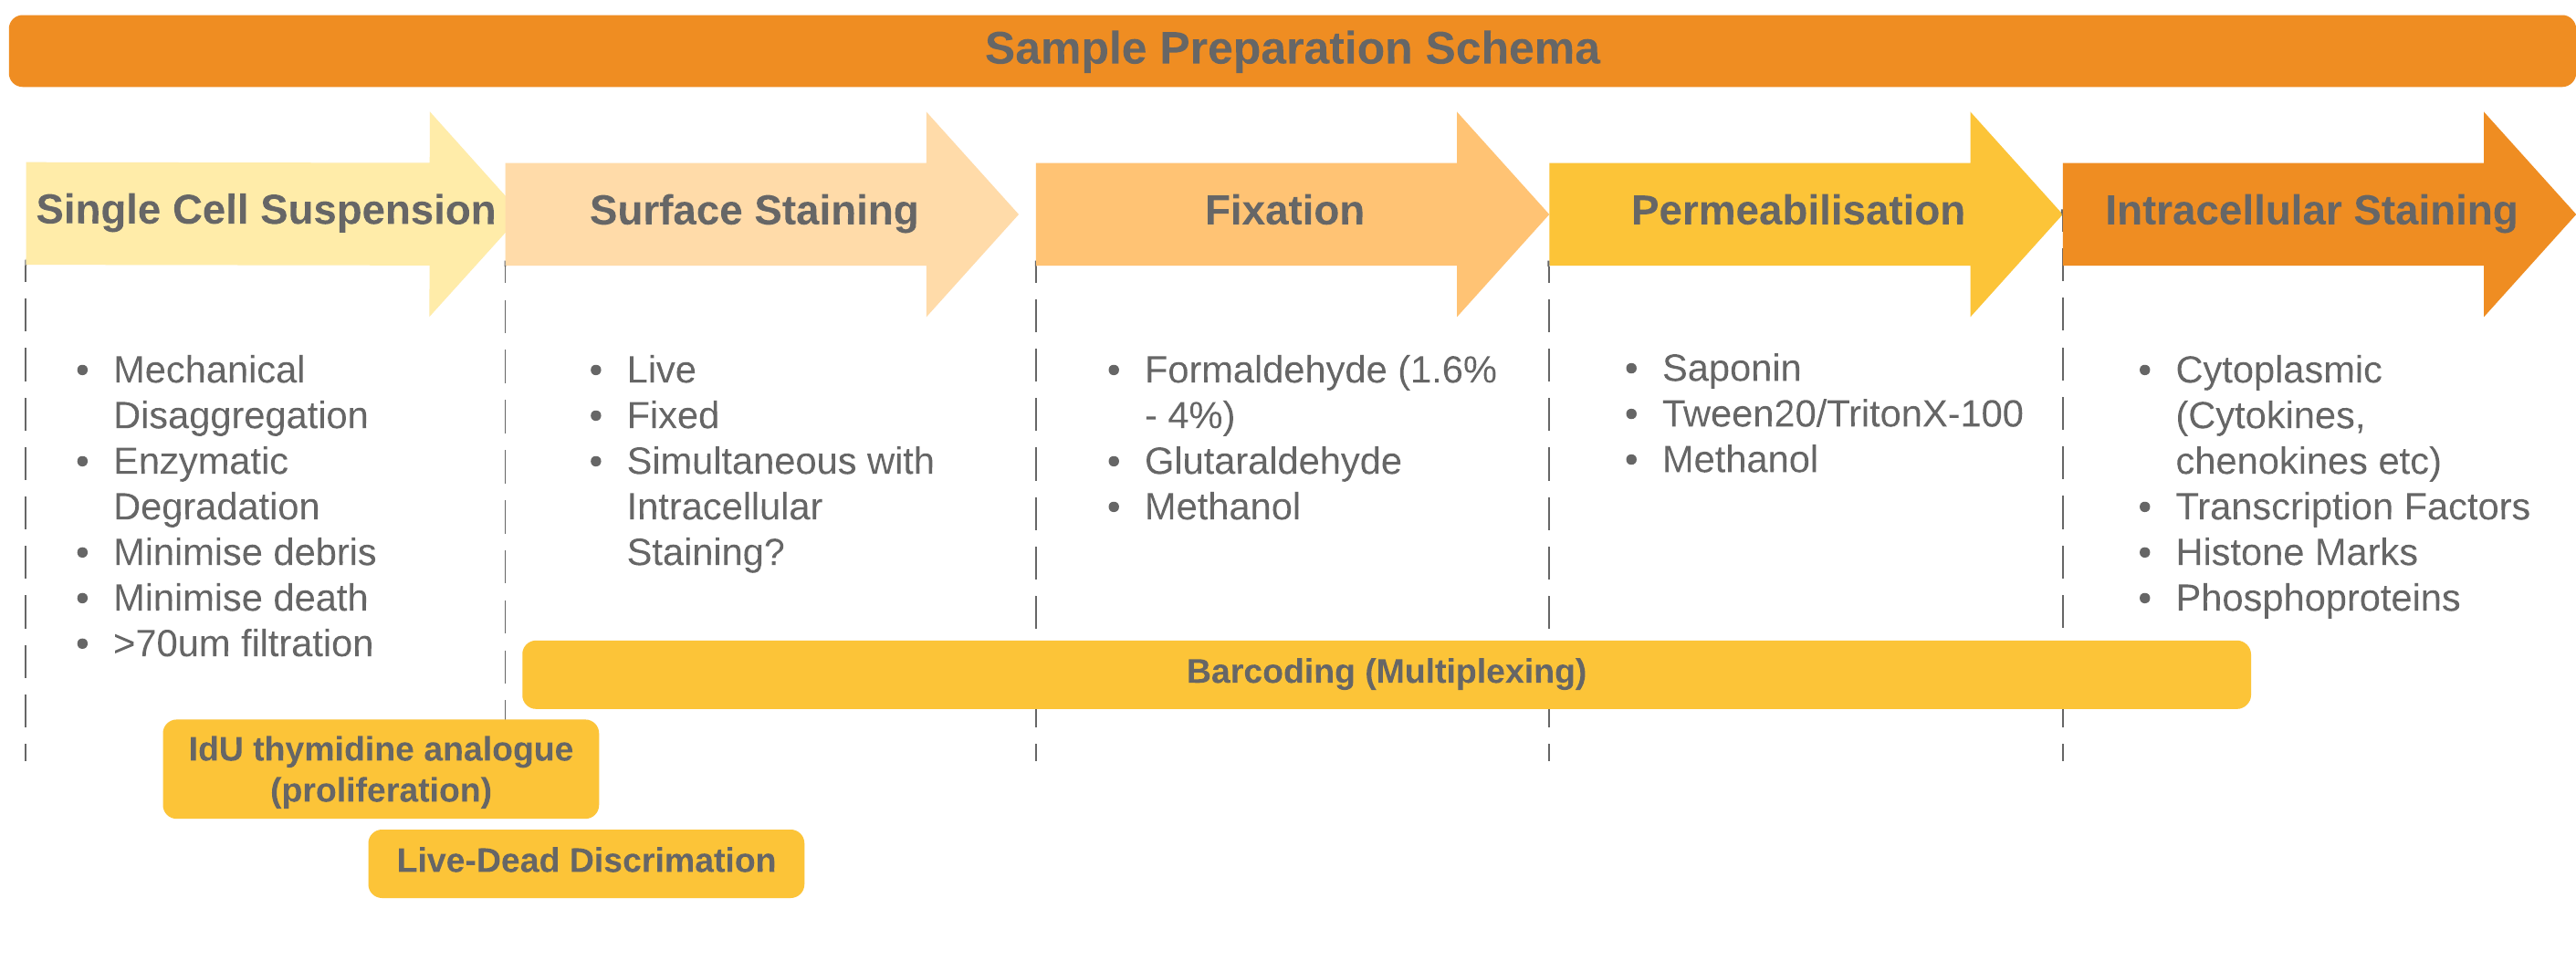
Staining
Once you have your single-cell suspension we are ready to stain the cells with antibodies. There are 4 main steps to combine to fully stain cells: * Surface Staining * Fixation * Permeabilization * Intracellular Staining
We can also supplement these steps with more probes depending on the needs of your study:
- Barcoding for multiplexing
- Barcoding in mass cytometry is achieved by a kit using Palladium isotopes in the mass range from 106-112. This kit allows us to multiplex 20 samples.
- Barcoding allows us to stain samples simultaneously to:
- Account for pipetting errors when significant differences may be very small
- Helps to differentiate doublets mroe easily (invalid barcodes can be screened out)
- BUT results in lost sample - there is an additional fix-perm step to understake and any cells that are not fully stained will be excluded from analysis by the debarcoding algorithm
- Loading IdU for proliferation tracking
- IdU is a thymidine anlaogue just like BrdU or EdU that we can pulse cultured cells with to identify cells in S phase
- Loading cis-platin amine-reactive dyes for Live-Dead Discrimination
- Just like flow cytometry, it is crucial to remove dead cells from our analysis.
- Identifying cells - In mass cytometry we cannot identify cells via light scatter AND any cell that is negative for all the markers in you panel is invisible to the instrument. To counteract this we stain all cells with Iridium or Rhodium (DNA intercalators) so that even null events can be identified by their DNA content. This stain also helps to identify debris from intact cells.
Surface Staining
Surface staining should closely replicate your flow cytometry protocols (if you have them!) - you may already know what works well from these applications. If you haven’t done any flow cytometry at all or on this particular cell-type or tissue, no problem; we can follow best practises:
- It’s often best to do the surface stain on live cells before any fixation occurs. Most of the CD antibodies we use were developed to stain cells for flow cytometry and were often developed for sort applications, using live cells that could be cultured or analysed downstream.
- Are you barcoding your samples? IF yes you may already have fixed your cells at this stage so the question of fixation is already answered.
Fixation
Fixation is absolutely necessary in mass cytometry samples, regardless of the type of staining undertaken - mass cytometry samples are acquired in pure or near pure ddH20. If you are only surface staining you could fix at the end but otherwise fixation early on in your staining protocol will happen. I generally recommend doing surface staining on live cells and then fixing after. The cells are then ready for permeabilisation and further staining, processing or acquisition.
Crosslinking fixatives
The primary crosslinking fixative used in biological assays is formaldehyde (generally 1.6%-4% w/v solutions are used).
Formaldehyde works by forming covalent bonds between amino acids, primarily lysines, causing proteins to be crosslinked into cage-like structures.
There are very niche applications where 1% gluteraldehyde might need to be used (running erythrocytes is an example of this where even with PFA fixation significant haemolysis occurs). Gluteraldehyde generally crosslinks “better” or more “rigidly” because it is a larger molecule (with 2 reactive aldehyde groups) and so can crosslink proteins over greater distances. However, the increased size means that gluteraldehyde often takes longer to get into cells and tissues so take this into account if you are thinking about using it.
In general using 2-4% PFA will work for all common applications (but be prepared to test alternative concentrations)
The major advantage of crosslinking fixatives is their action retains the secondary and (often) tertiary structure of proteins, which may be important for some conformational epitopes that antibodies react with.
Agglutination/Precipitating fixatives
This class of fixatives includes alcohols (Methanol/Ethanol) and compounds like acetone. They predominantly work by agglutinating proteins, causing their precipitation (by disrupting the hydrophobic core of proteins). They do not retain the secondary structure of proteins due to their denaturing action. This can help some antibodies and hurt others.It’s most often employed in mass cytoemtry protocols when we are using phospo-protein antibodies to probe signalling chains.
Permeabilization
Fixation can serve 2 functions * Crosslink surface antibodies onto proteins to retain them * Crosslink proteins in the cell so that they retain structure even if the cell membrane is removed or reduced in integrity.
Permeabilization is always preceded by fixation in mass or flow protocols - otherwise you just lyse the cells.
Saponin
Saponin is a mild detergent and the mildest permeabilisation protocol that we can use. Its action of permeabilisation functions by reacting with and removing cholesterol molecules from lipid membranes. This creates small “holes” in the membrane through which antibodies can pass (and small proteins can escape the cell if they are insufficiently cross-linked via your fixation protocol.
Advantages
Saponin is the mildest permeabilization agent routinely used. It can be completely reversed by removing the cells from the saponin-containing solution i.e. washing the cells in stain buffer etc. It’s a great reagent for doing intra-cellular staining of cytoplasmic proteins - the canonical application being intracellular cytokine staining. It doesn’t react with proteins so it doesn’t interfere with staining of surface proteins.
Disadvantages
Saponin’s very specific mode of action prevents it from being useful for intra-nuclear staining - the nuclear membrane has very low leves of cholesterol.
How to identify saponin in proprietary reagents
Saponin must be listed on datasheets so you can look up your safety sheet to tell if saponin is present. Another simple way to tell if saponin is being used is if the protocol requires a special wash buffer e.g. BD Cytofix and Perm. Given the reversible nature all wash and perm buffers must contain sapoinin so if your kit requires a proprietaty wash buffer it’s a dead giveaway that saponin is involved.
Saponin-plus
The major disadvantage of Saponin permeabilisation is the inability to use it for intra-nuclear staining. Saponin works through interaction with cholesterol. Cholesterol is rare in the nuclear membrane. To enable us to stain for intra-nuclear proteins like transcription factors, we can use Saponin but add a stronger, more reactive detergent. Triton-X and Tween are popular. They are often used at concentrations of 0.1-0.5% in 0.5% Saponin buffers. Many of the proprietary buffers that are recommended for intranuclear staining have a formulation similar to that described in this section. These stronger buffers have a broader spectrum of action reacting with more lipids than cholesterol (but also some proteins)
Advantages
Probably the most well-rounded permeabilisation allowing for simultaneous staining of surface, cytoplasmic and intranuclear antigens.
Disadvantages
Tween20 and Triton-X are able to permeabilise the nuclear membrane allowing for intranuclear staining because they are more reactive detergents. They react with a wide range of lipids AND proteins. Particularly the protein-reactivity can have a deleterious effect on some (surface) staining - the detergent strips some proteins away reducing maximal staining.
Methanol
Methano has been used as a way to permeabilise cells and enable staining for phosphoproteins and some transcription factors (with low background). It may be that many of the antibodies used for phosphoproteins and some transcription factors were developed for Western and immunoblotting where denaturation is typical. Therefore, staining under perm conditions that recreate denaturing conditions (Methanol) is sensible. Using very cold Methanol works well for many of these proteins and is often an essential component of a staining protocol if you are analysing many phosphoproteins simultaneously.
Advantages
Can be the only method that will yield valid staining for some antibodies, most notably phosphoproteins.
Disadvantages
Methanol permeabilisation can cause significant cell loss if care is not taken. The dehdrative/preciptative effect of methanol can cause large irreversible cell clumps to form resulting in huge sample losses.
Intracellular Staining
Once the fix-perm conditions ahve been optimised, intracellular staining is as simple as adding the correct titrations of the relevant antibodies.
Sample Acquisition
Samples at OHRI are acquire by the CyTOF operator at an event rate of between 300-500 events/sec to the file size or cell count agreed upon by the user and operator.
Cell Acquisition Solution
Traditionally cells are acquired in ddH20. This leads to cell loss, even in fixed cells. To reduce losses associated with putting your samples in water, at OHRI we acquire your samples in Cell Acquisition Solution (CAS). CAS is a 0.1% salt solution (likely of ammonium nitrate) that helps stabilise the cells.
Data Analysis
If you’ve ever had to manual gate data from an 11-colour fluorescent flow cytometry experiment in FlowJo or similar you’ll know that manual gating will not work well for over 30 parameters. It’s too much data and takes too much time. Manual gating is also prone to bias, lack of reproducibility and doesn’t analyse all of the data collected (if you only gate on one quadrant per plot you are essentially throwing away 75% of all of your data at each step in the gating tree.
Many new technologies and analytical techniques have been developed and adapted from other computational analysis techniques such as single cell sequencing.
Dimensionality Reduction
Dimensionality reduction is a method that “flattens” high parameter data from n dimensions down to an easier to understand 2 dimensions
Dimensionality Reduction techniques used in genomics like Principle Component Analysis can be used with some success but Cytometry data is not normally distributed and is not necessarily a vector (inreased expression/decreased expression) meaning PCA is not always a good fit for analysing mass cytometry data.
t-Distributed Stochastic Neighbour Embedding
tSNE and the associated viSNE were the original ways used by cytometrists to visualise high dimensional data in 2D. It is a powerful technique for non-linear data like fcs files. However, beware reading too much into the layouts it produces. tSNE produces even islands that can look very like clusters but there is no useful information in how the tSNE plot is laid out - you must rely on clustering algorithms to provide that information.
Uniform Manifold Approximation and Projection
A newly applied algorithm to high-dimensional cytometry data. It competes well with tSNE - it computes much faster and on larger data sets. Furthmore, because UMAP retains more of the global features throughout the algorithmic process the final 2D appearance of the map can provide some cluster-like information.
Hierarchical Stochastic Neighbour Embedding
Similar to tSNE but runs faster and with lower computaional requireements - a strong update to tSNE making it more competititve agaisnst newer algorithms like UMAP and PARC.
Clustering
Dimensionality reduction techniques like tSNE or UMAP let us visualise the data in a simple way. However, we often perceive patterns in the data that are just random noise. Clustering techniques define similar groups and populations in the data in an unbiased and unsupervised way. There are many avaialble methods to do this including:
FlowSOM
FlowSOM (Self Organising Maps) was developed as a custom technique to cluster high dimensiona flow data. It is a very fast, very simple technique to cluster your data.
Phenograph
Probably the most used clustering algorithm, Avaialble in FlowJo and cytofkit. It is a fast and accurate clustering algorithm
Additional Analysis
The standard high dimensional analysis tends to be
Clean data (normalise, doublet discriminate, Remove dead cells) → dimensionality reduction → cluster → interpret.
However, we are beginning to realise deeper and extended analyses on top of this standard architecture. One of the most use of these is:
Trajectory Analysis
Trajectory analysis, which adds probabilities of the kinetic trajectory of populations i.e. probabilities of which populations precede or are antecedent. Combined with kinetic studies this type of algorithm can be very powerful in defining developmental or kinetic studies. Useful packages include SPRING and FlowMAP.
Guides
How It Works
Panel Design
Sample Preparation